
Stránky farnosti sv. Matěje
Losovali tedy a los padl na Matěje - Sk 1,26


30. 6. 2026
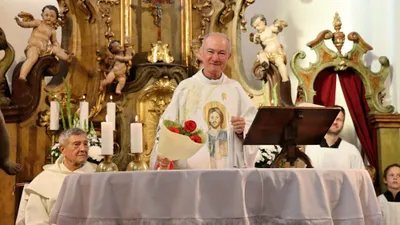
FOTOGALERIE: 20. výročí kněžského svěcení P. Matúše
Ve středu 24. června 2026 na slavnost Narození sv. Jana Křtitele jsme oslavili 20. výročí kněžského svěcení našeho pana faráře P. Matúše Kociana. V kostele sv. Matěje byla v 18:00 hodin mše svatá, po ní následovalo setkání kněží, jáhnů, ministrantů, farníků, hostí , rodiny a známých P. Matúše při pohoštění na farní zahradě.
9. 6. 2026
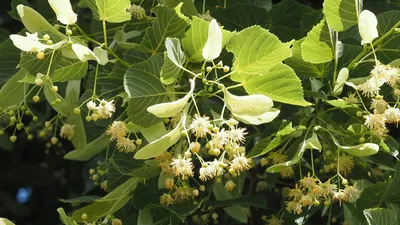
Kvetou lípy velkolisté
Lípy jsou významné včelařské dřeviny. Kolem kostelů často bývá vysazených několik různých druhů lip. Ty se odlišují především jiným termínem kvetení. To je pro včely a čmeláky a další druhy hmyzu velmi důležité, že kvetení různých stromů na sebe časově navazuje. Pokud se totiž někde v krajině vyskytují během jara a léta týdny, kdy nekvete vůbec nic, tak tím vznikají všemu hmyzu veliké potíže. Včely medonosky sice mohou mít v úlech zásoby, které jim pomohou hladové období přežít, ale třeba pro hnízdečka čmeláků může být takové období bez květů likvidační. V minulých stoletích faráři přírodě rozuměli a nechávali vysazovat na hřbitovech a v parcích stromy tak, aby od jara až do pozdního léta vždycky včelám některý strom kvetl.
3. 6. 2026
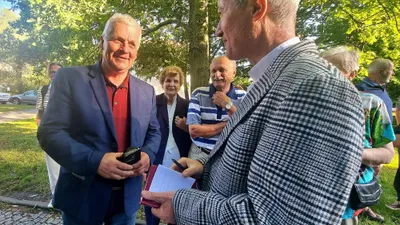
FOTOGALERIE: Vzpomínkové setkání u stromu P. Jana Machače
V pondělí 1. června proběhlo v parku na Hadovce vzpomínkové setkání u stromu P. Jana Machače. Akce se uskutečnila u příležitosti 111. výročí narození bývalého dlouholetého faráře u sv. Matěje.
O farnosti
Kostel sv. Matěje
Objevte příběh kostela sv. Matěje, významné náboženské a kulturní stavby, jejíž počátky jsou v kronikách spojovány již s rokem 971.
Více o našem kostelu

Perníkové jesličky
Tradice svatomatějského perníkového betlému sahá až do roku 1972. Přečtěte si více o jeho historii a současnosti.
Více o perníkových jesličkách
