
Stránky farnosti sv. Matěje
Losovali tedy a los padl na Matěje - Sk 1,26


23. 7. 2026
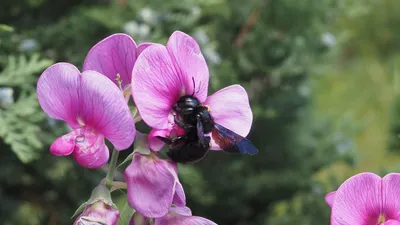
Drvodělka fialová
Následkem oteplování klimatu se u nás stále častěji objevují jihoevropské druhy hmyzu. Jedním takovým druhem je samotářská včela Drvodělka fialová (Xylocopa violacea), v posledních zhruba deseti letech jí často můžeme vidět létat i kolem matějské farní zahrady.
30. 6. 2026
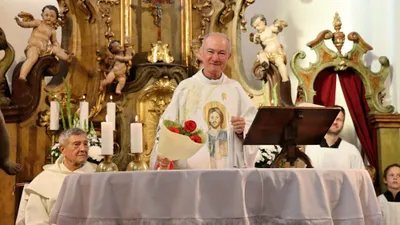
FOTOGALERIE: 20. výročí kněžského svěcení P. Matúše
Ve středu 24. června 2026 na slavnost Narození sv. Jana Křtitele jsme oslavili 20. výročí kněžského svěcení našeho pana faráře P. Matúše Kociana. V kostele sv. Matěje byla v 18:00 hodin mše svatá, po ní následovalo setkání kněží, jáhnů, ministrantů, farníků, hostí , rodiny a známých P. Matúše při pohoštění na farní zahradě.
29. 6. 2026
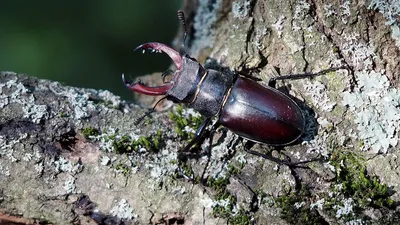
Brouk roháč obecný
V předposlední červnovou neděli mne cestou na ranní mši přede dveřmi do kostela překvapila nečekaná návštěva - brouk roháč obecný. Vlastně měl stejnou barvu jako zdejší kameny na zemi, riskoval, že ho někdo omylem zašlápne. Proto jsem brouka roháče odnesla ven až za hřbitovní zeď a tam jsem ho položila na kmen dubu. On pak rychle odpochodoval nahoru a ztratil se mi z dohledu až vysoko v dubové koruně. Ale než utekl z dosahu, tak jsem stihla udělat pár dokumentačních fotografií.
O farnosti
Kostel sv. Matěje
Objevte příběh kostela sv. Matěje, významné náboženské a kulturní stavby, jejíž počátky jsou v kronikách spojovány již s rokem 971.
Více o našem kostelu

Perníkové jesličky
Tradice svatomatějského perníkového betlému sahá až do roku 1972. Přečtěte si více o jeho historii a současnosti.
Více o perníkových jesličkách
